This the seventh post in the Gorans Blog Series about the Gorans Discovery Farm Project. You can read the previous posts here.
In the last two posts, we explored how much total suspended solids (sediments), phosphorus, nitrate and ammonium were carried in runoff and drainage water into the waterways. While the data we gathered from our fields on the Gorans Farm and from the City Stormwater Site are important, we know they don’t tell the whole story. To get a better idea of the true impact we need to scale up and look at the entire watershed.
Comparing cropland and urban areas on a watershed scale
An important factor when it comes to understanding the contaminant loads in the watershed is understanding how much of the watershed is urban and how much is cropland. For the Lake Wakanda watershed, approximately 3,180 acres (18%) are urban areas and 14,730 acres (82%) is cropland. As you can see, in this watershed, there is more than four times the acreage in cropland. Other watersheds will have different percentages of urban and cropland areas.
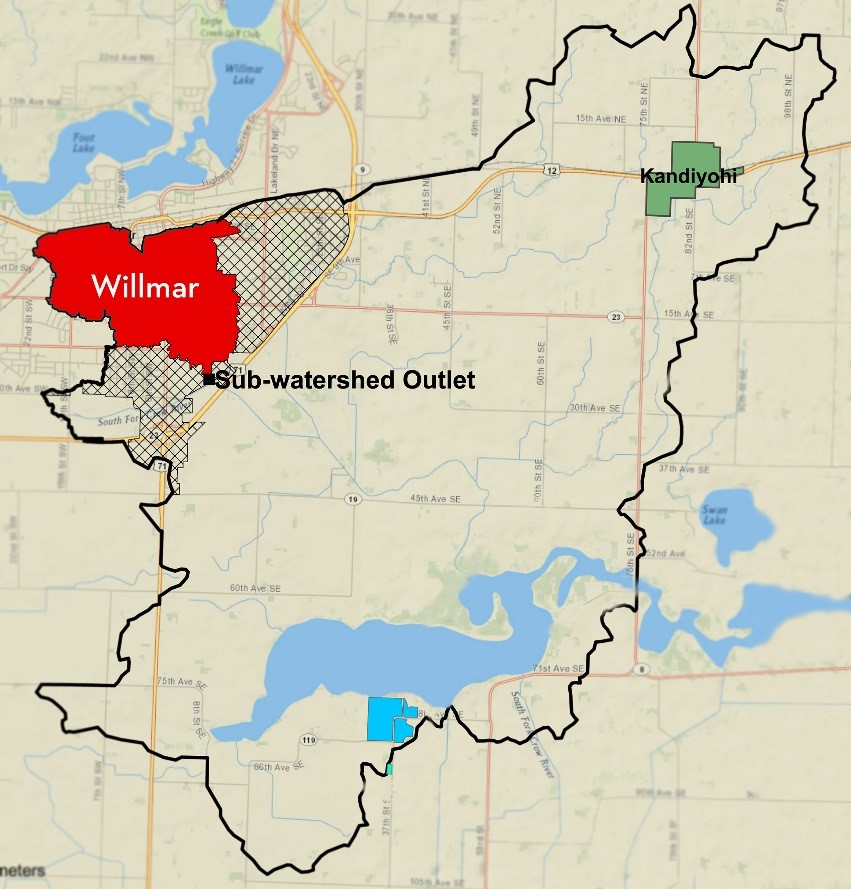
In order to scale up to the watershed, we had to make some assumptions about these urban and cropland areas. We couldn’t know exactly what management practices other farmers were using, but we could assume they were similar to the Fertilized Field. The same goes for the urban areas. While there may be differences, for our purposes we assumed other urban areas would transport loads similar to the City of Willmar Stormwater Site.
Given these assumptions, we used the loads of contaminants on a per area basis (lbs./acre) from our 7-year study and multiplied that by the total area of cropland and urban areas in the Lake Wakanda watershed. When looking at total suspended solids, we found that the urban area contributed higher total loads (lbs.) than the cropland area (2,184,320 lbs. compared to 850,090 lbs.) at the watershed level over the 7 years. Similarly, when looking at the ammonium loads the urban areas again contributed more (10,300 lbs. NH4-N compared to 4,520 lbs. NH4-N). In contrast, the cropland areas had higher total phosphorus (15,980 lbs. P compared to 7,600 lbs. P) and higher loads of nitrate (1,796,030 lbs. NO3-N compared to 31,190 lbs. NO3-N).
Conclusions
At the watershed scale, urban areas contributed 2.6 times more total suspended solids and 2.3 times more ammonium. In contrast, cropland areas contributed 2.1 times more total phosphorus and 57.6 times more nitrate.
It is important to note that these comparisons are based on the period from April to October when the majority of water flow occurred. Furthermore, the load estimates from cropland and urban areas are not necessarily what actually flows into Lake Wakanda. Conservation practices can reduce peak flow, remove sediments and nutrients, and help reduce the transport of these contaminants. Overall, our load estimates are based on assumptions, so we advise caution in generalizing about load quantity for other watersheds.
Based on these results, similar watersheds should target reducing total suspended solids and ammonium and from urban areas, and nitrate from cropland. Total phosphorus should be a focus for both. For urban areas, conventional stormwater control measures (i.e., dry and wet ponds) and more innovative measures (i.e., green roofs, permeable pavement, bioretention, vegetated open channels, sand filters and wetlands) aimed at reducing peak flow and removing sediments and nutrients are possible solutions. For cropland, controlled drainage, bioreactors, constructed wetlands, and improved nutrient management practices are possible solutions.
In our future posts, we will look at a couple of conservation practices we are currently studying, including bioreactors to lower nitrate loads from cropland.
Field Day November 10th
Want to see the Gorans Discovery Farm for yourself and get a sneak peek at the experimental bioreactor? Join us for a field day on Friday, November 10th at 10 a.m. Learn more on the Department of Soil, Water, and Climate’s website.
- Gorans Blog Series: Looking at the watershed scale. - November 6, 2017
- Gorans Blog Series: Nitrogen movement. - October 23, 2017
- Gorans Blog Series: Sediment and phosphorus movement. - October 2, 2017