This the second post in the Gorans Blog Series about the Gorans Discovery Farm Project. You can read the first post here.
Understanding the problem
Before coming up with solutions, we first really have to understand the problem. Kim Gorans, from Gorans Farms came to us with the problem – algae blooms and a history of impaired water quality in Lake Wakanda. The Environmental Protection Agency (EPA) attributed the blooms to high levels of phosphorus, nitrogen, and total suspended solids in the water back in 1974. What we needed to do was find out where runoff water was coming into the lake and where the excess nutrients and sediments were coming from.
Looking at the topography and watershed of the area, it was clear that some water was coming into the lake from agricultural fields and drainage and some was coming from the nearby town of Willmar. For our study, we decided to focus on three areas from which water would runoff into the lake.
- The main stormwater ditch from the City of Willmar
- The Gorans Farm west field tile output into a wetland
- The Gorans Farm east field tile output into a wetland
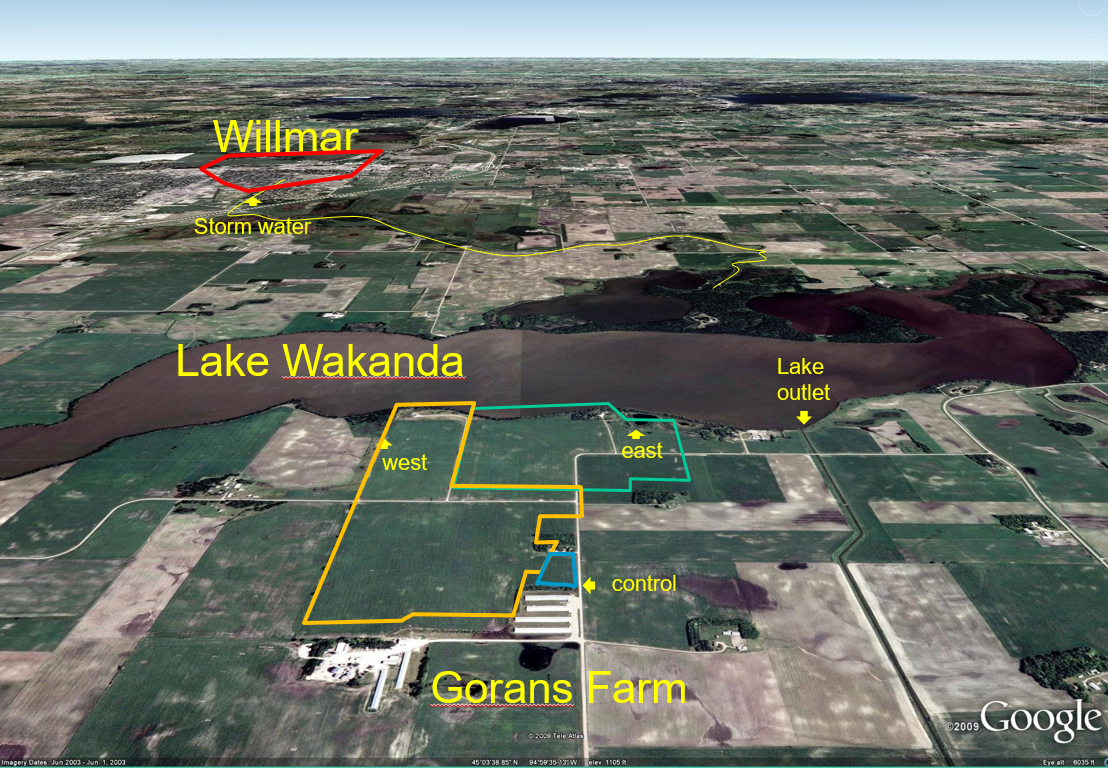
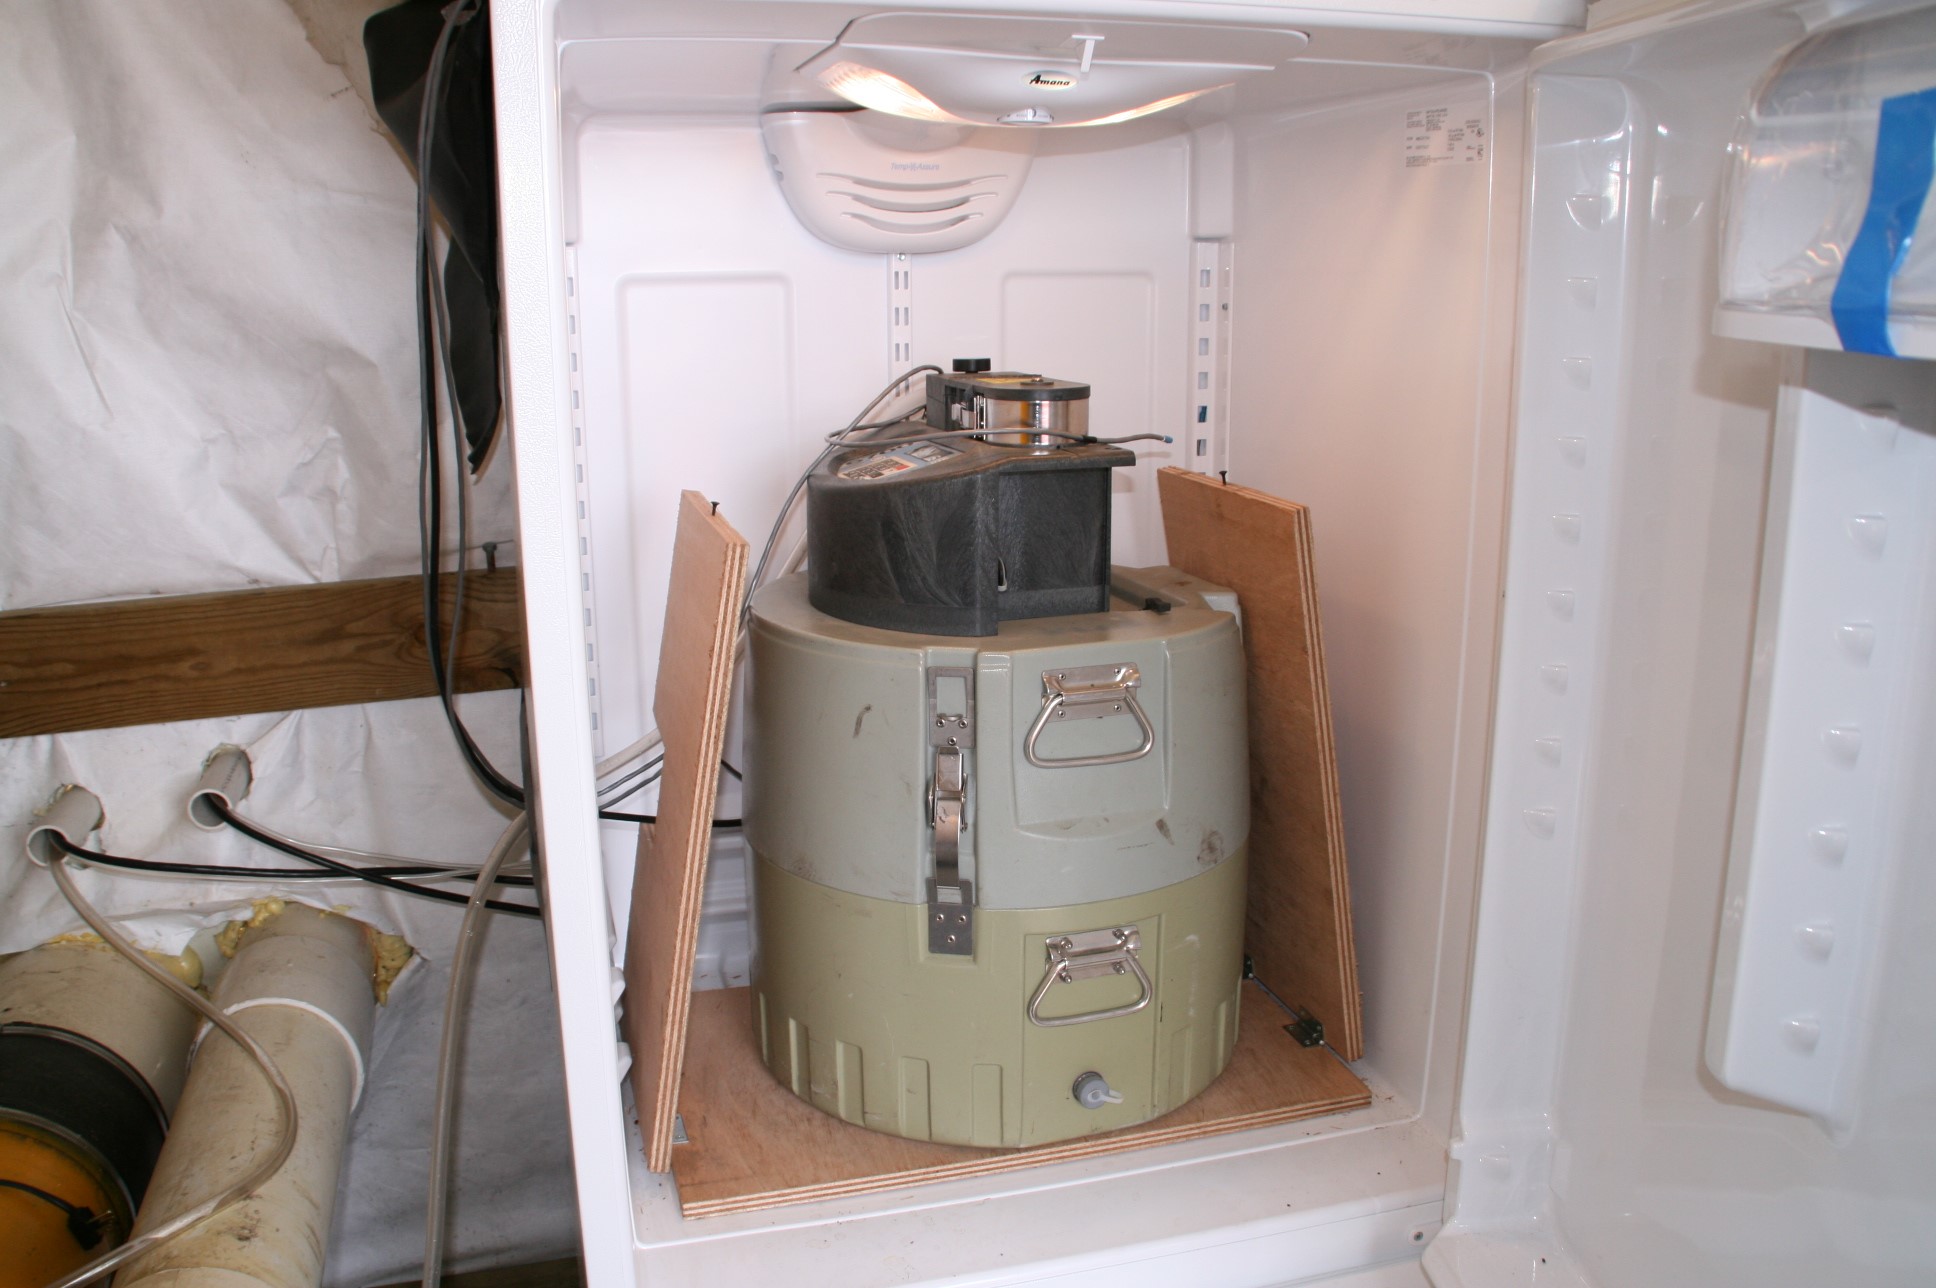
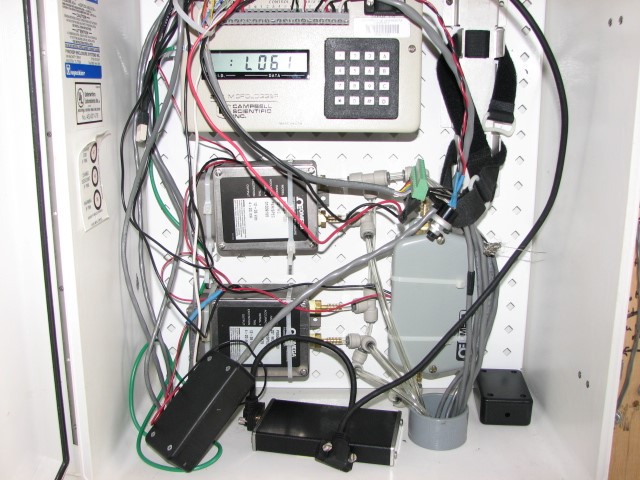
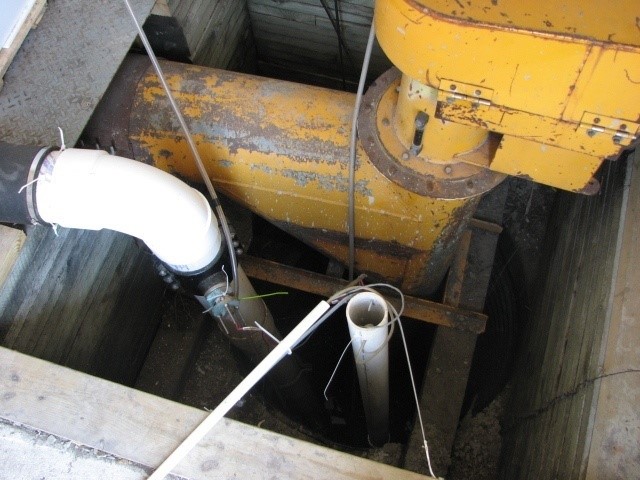
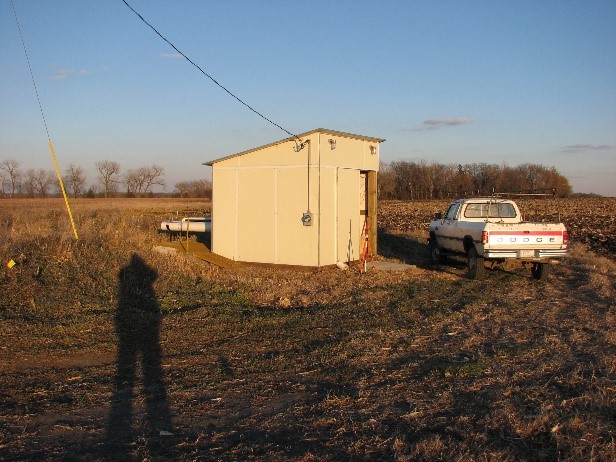
Once the water runoff sites were identified, we needed a way to collect samples of the water. Computers, automatic samplers, sensors, and collection sites were installed. Gorans Farm constructed a small building to protect the equipment at all of the sites. Additionally a fourth site was included where samples were also collected from a non-fertilized field to be used as a control.
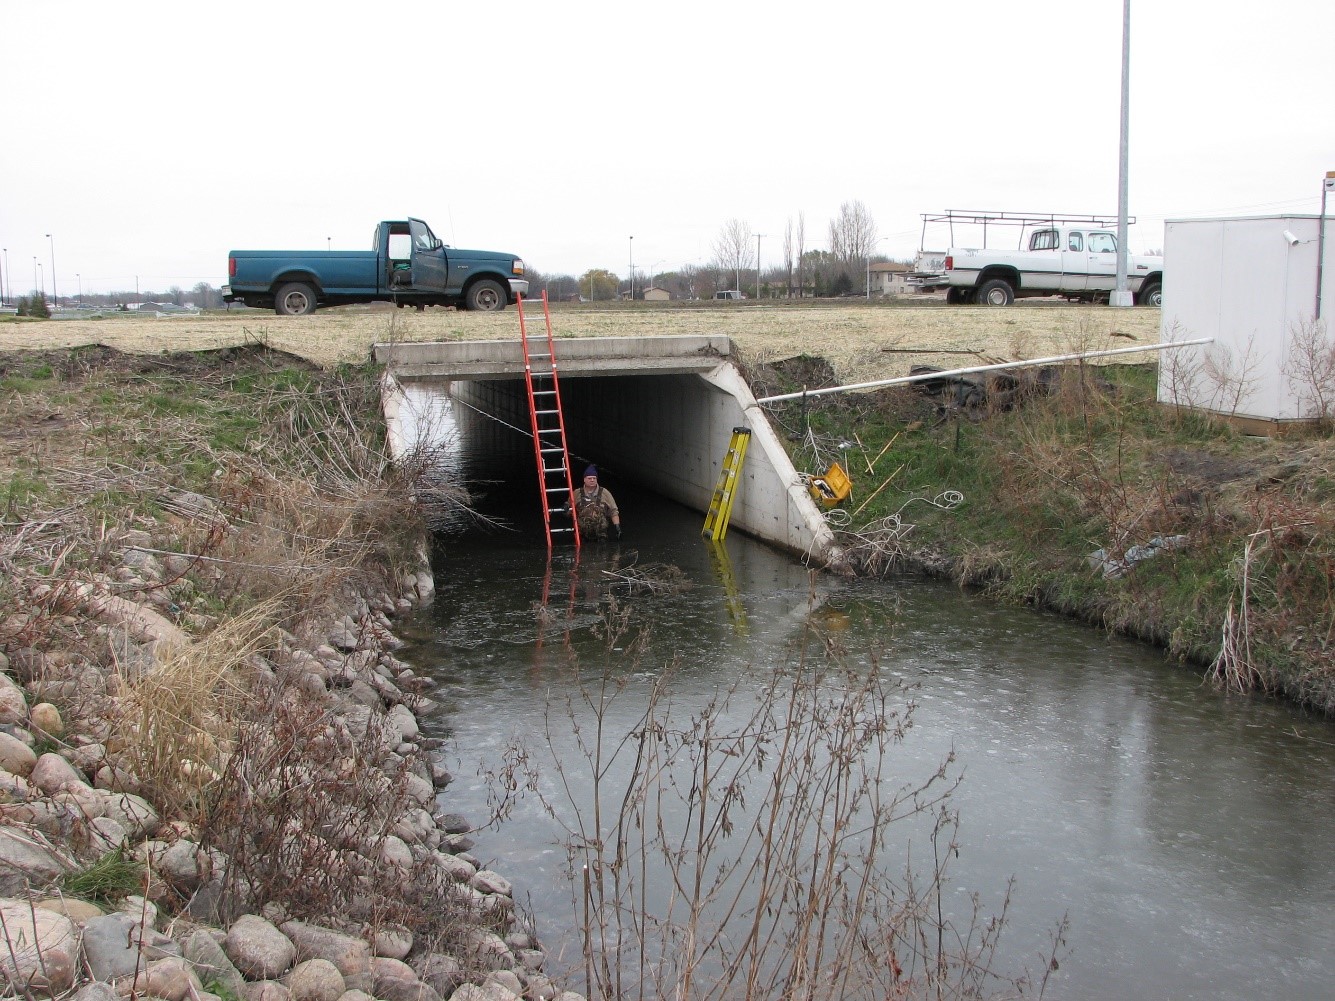
Water samples were also collected from the City of Willmar’s main stormwater ditch using the same equipment setup. Samples were collected at Gorans Farms and the stormwater ditch from spring thaw (April) all the way until freeze up (usually November).
This equipment allowed us to collect water samples every day from the farm sites as well as from the city. Phosphorus, nitrogen, and total suspended solid (sediment) levels were measured in each sample. We also kept track of the total amount of water flowing from each site so a good estimation of the total amount of phosphorus, nitrogen, and suspended solids entering Lake Wakanda from the sites could be made.
All of the sampling equipment was installed and working by spring of 2007. With the equipment in place, we continued to measure and analyze the water samples at both locations for seven years to get a good, representative idea of how the runoff water changes over a period of wet and dry years.
Over those seven years, we also kept track of how the fields were used, what was grown, and how they were managed to see how that impacted the water runoff. For example, here’s the information we kept track of for the east field which had the same cropping system (minus the fertilizer and manure) as the control field:
Summary of crop sequence, fertilizer type and application rate and tillage system for east fertilized field| Description | 2007: Soybean | 2008: Corn | 2009: Corn | 2010: Soybean | 2011: Corn | 2012: Corn | 2013: Corn |
|---|---|---|---|---|---|---|---|
| Fertilizer type | None | Turkey litter & commercial fertilizer***** | Commercial fertilizer | None | Turkey litter & commercial fertilizer***** | Commercial fertilizer | Commercial fertilizer |
| Fertilizer application date | None | Oct 11, 2007 | Nov 11, 2008 | None | Oct 1, 2010 | Nov 4, 2011 | Oct 18, 2012 |
| Nitrogen application rate (lbs/acre) | None | 178 | 128* ** | None | 158****** | 152** **** | 131** **** |
| Phosphate application rate (lbs/acre) | None | 117 | 16** | None | 166 | 9** | 25** |
| Potash application rate (lbs/acre) | None | 88 | 65*** | None | 119 | 46*** | 22 |
| Tillage | Fall 2006 chisel plow | Fall 2007 moldboard plow | Fall 2008 chisel plow | Fall 2009 chisel plow | Fall 2010 moldboard plow | Fall 2011 chisel plow | Fall 2012 moldboard plow |
| Planting date | May 16, 2007 | May 5, 2008 | May 2, 2009 | May 6, 2010 | May 18, 2011 | Apr 27, 2012 | Apr 30, 2013 |
| Harvest date | Oct 4, 2007 | Oct 18, 2008 | Nov 17, 2009 | Sep 14, 2010 | Oct 28, 2011 | Oct 6, 2012 | Sep 25, 2013 |
| *Anhydrous ammonia. **Diammonium phosphate. ***Potash. ****Urea. *****61% and 39% of nitrogen was from manure and anhydrous ammonia, respectively. P and K were from manure. ******55% and 45% of nitrogen was from manure and anhydrous ammonia, respectively. P and K were from manure. | |||||||
In our next post in the series, we’ll begin to share what we learned about how the weather affected water runoff during those years.
- Gorans Blog Series: Looking at the watershed scale. - November 6, 2017
- Gorans Blog Series: Nitrogen movement. - October 23, 2017
- Gorans Blog Series: Sediment and phosphorus movement. - October 2, 2017