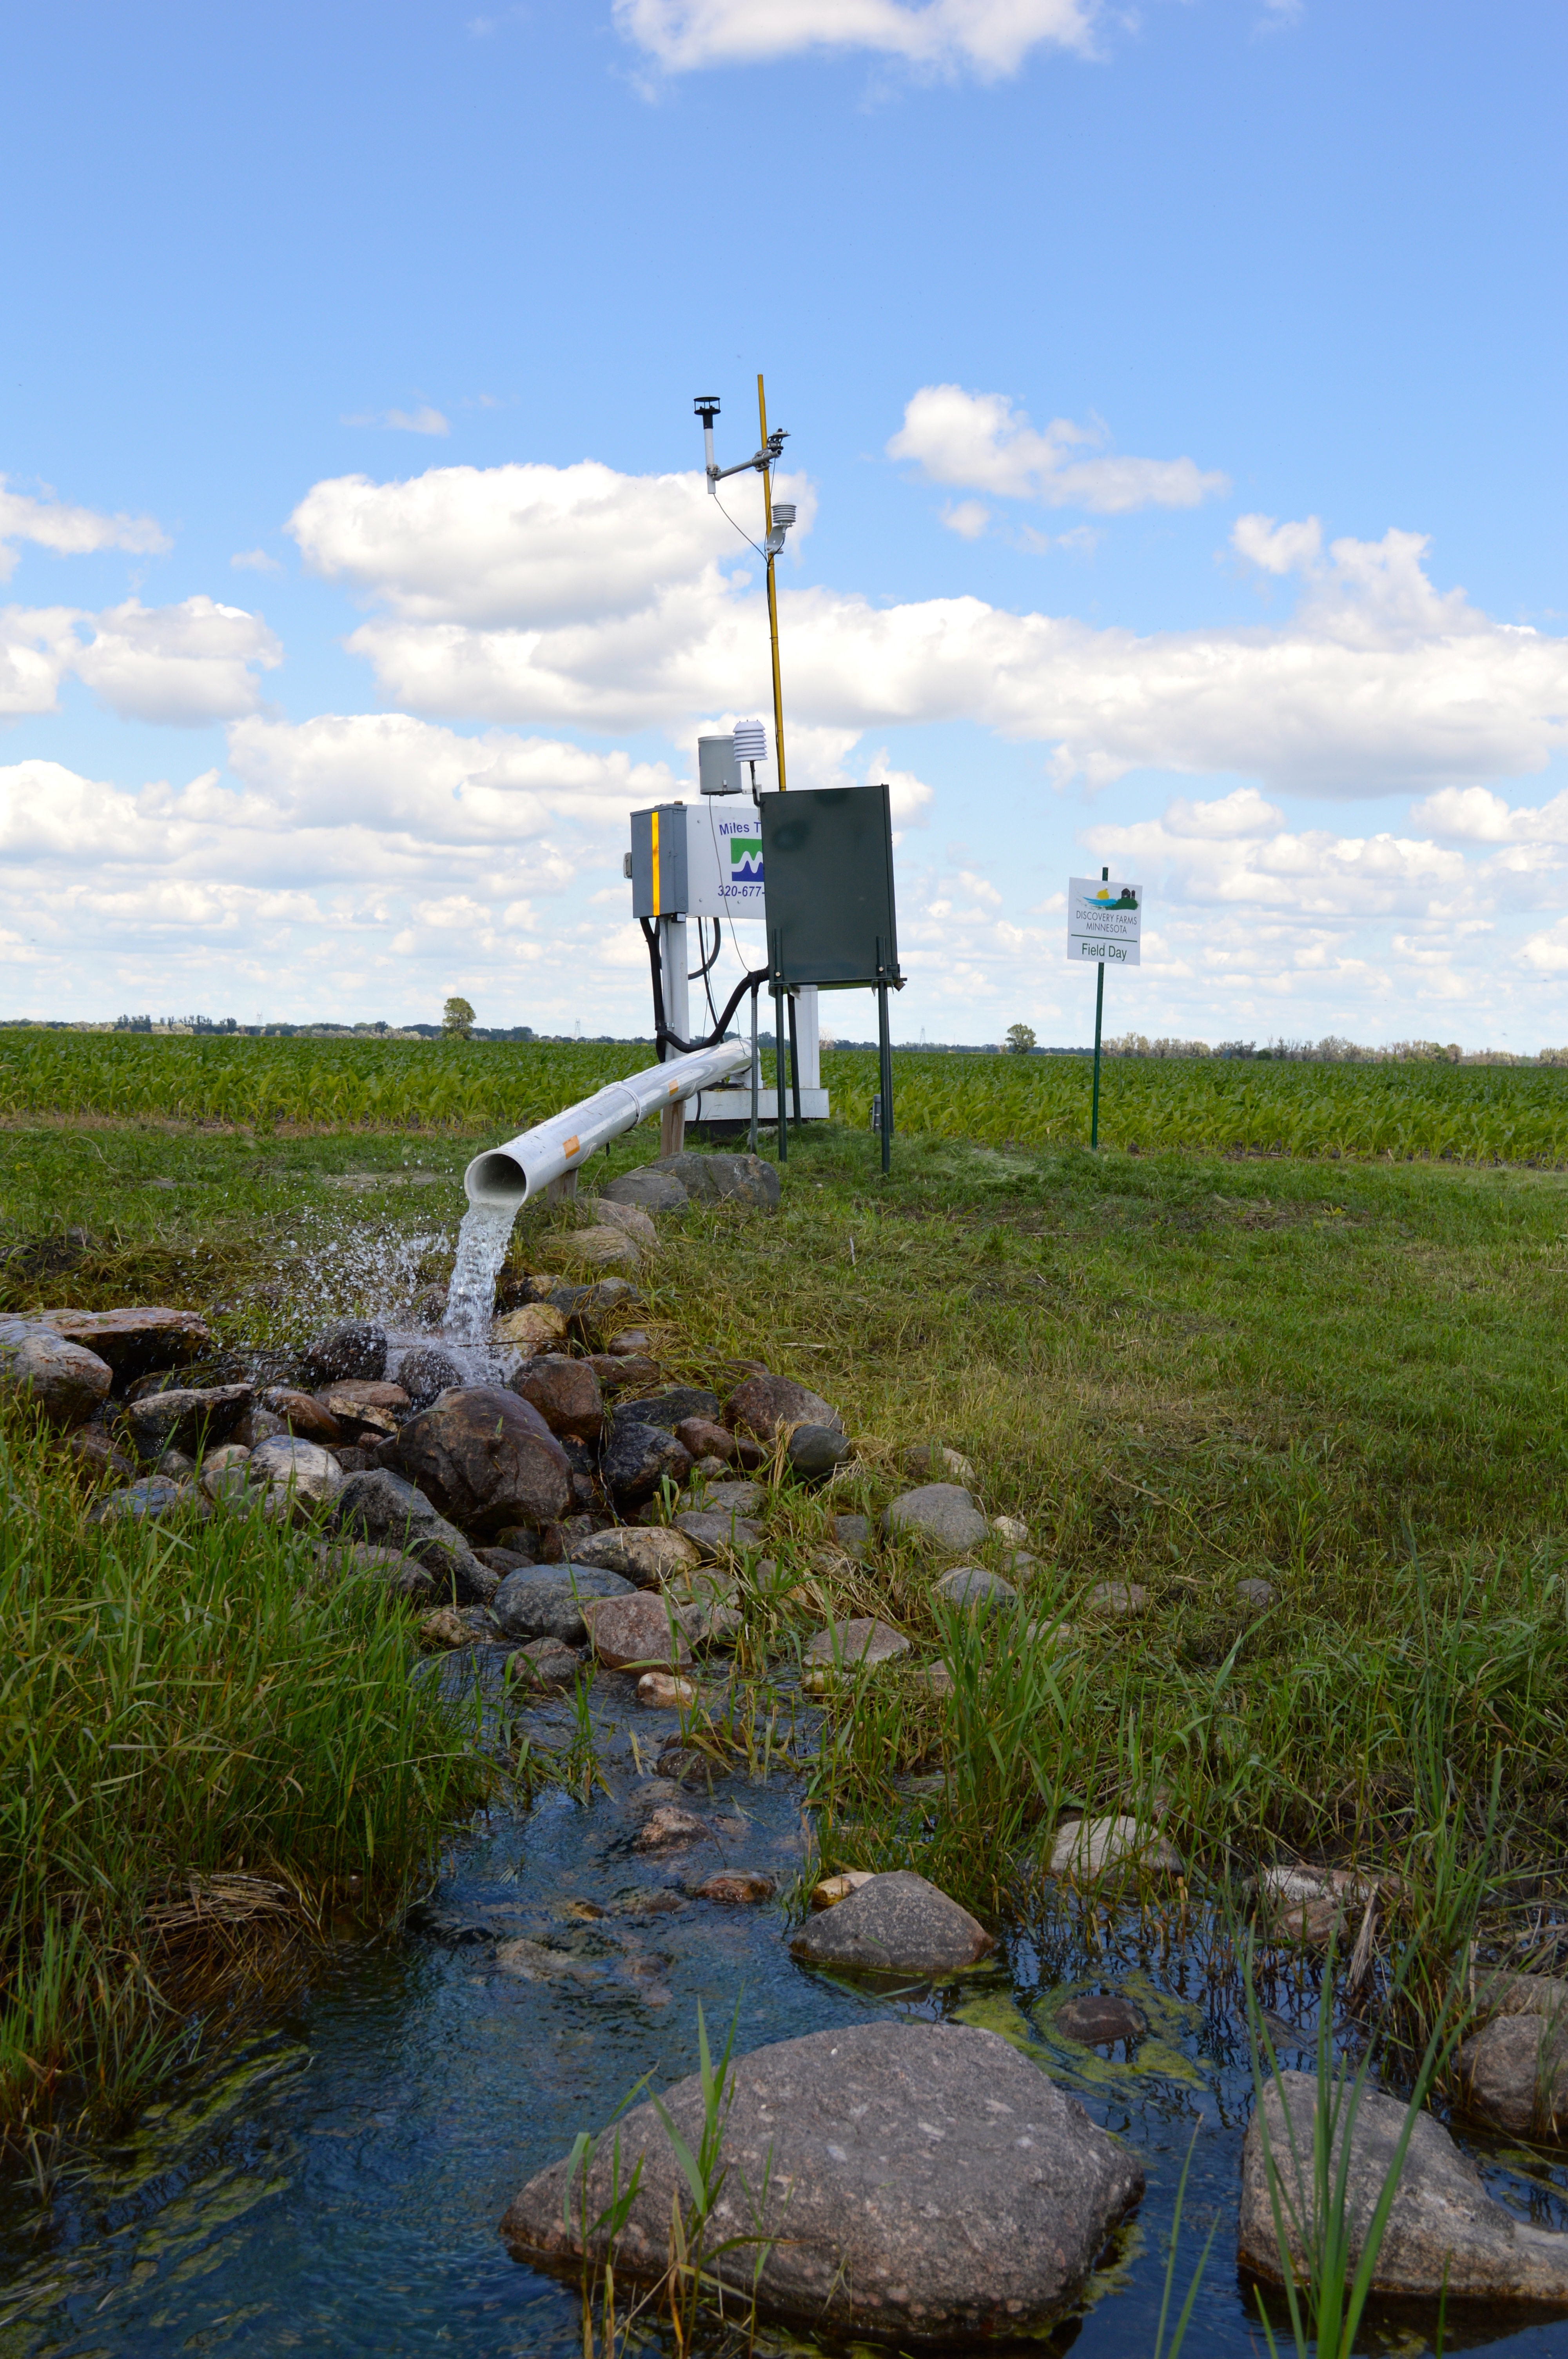
The Wisconsin and Minnesota Discovery Farms Programs received a Conservation Innovation Grant (CIG) to monitor tile drainage for three years starting in the fall of 2017. The project was titled Improving water quality and soil health on tile-drained lands. Our programs had three main goals for the project:
1) provide tools for farmers to use when making management decisions on tiled fields
2) supplement intensively monitored sites with lower intensity satellite sites to determine the feasibility of lower-cost monitoring options in conjunction with the intensive monitoring method
3) increase knowledge of the link between soil health and tile drainage water
This multi-state research project actively monitored tile drainage systems from the fall of 2018 through the fall of 2020. Data was collected from 48 sites (24 in each of the two states) on 35 farms making up 144 site years. Each year, we presented data reports to the participating farmers so they could take a look at what was happening at monitoring sites on their farms. We also shared data with other farmers, crop consultants, agency personnel, and community members through regional data meetings, presentations, and articles.
Multiple levels of monitoring
Each state had four intensively monitored sites, each in its own county. Intensively monitored sites continuously monitored flow and water quality. Two additional types of monitoring sites were monitored in proximity to an intensive site. Intermediate sites continuously monitored flow but only sampled water bi-weekly. At basic sites, the flow was recorded and water was sampled every two weeks. Bi-weekly samples were also taken at the intensive sites to correlate with the other sites sampled. The United States Geological Survey (USGS) used the flow and water quality data from the intensive and satellite sites to determine if modeling can produce reliable data.
Each tile system responds differently
 The most obvious conclusion from our monitoring is that not all tile systems are the same and should be managed specifically to their needs. Minnesota tiles flow differently than Wisconsin, and tile systems within each state flowed differently from each other. Flow frequency of monitored tile systems ranged from a few weeks per year to year-round. Tiles responded differently to weather events, tile type, age and condition which influenced flow and constituent concentration trends. Data indicates field activities such as tillage and nutrient applications also influence tile drainage activity. Understanding how your tile works and the timing and mechanisms for soil and nutrient loss will aid decision-making to properly manage tile systems.
Soil health link
At tile monitoring locations, soil samples were collected and analyzed for several soil health metrics. We chose soil health metrics to see if there was a correlation with water quality results. Intuitively, it seems there would be a relationship between soil health and tile drainage water. However, no strong correlations were observed in the data. The many variables that influence tile flow and constituent concentrations might be masking a correlation to soil health.
Although the project is complete, data will be further analyzed to gain additional knowledge of tile drainage flow patterns and the timing and magnitude of soil and nutrient loss through tile systems.