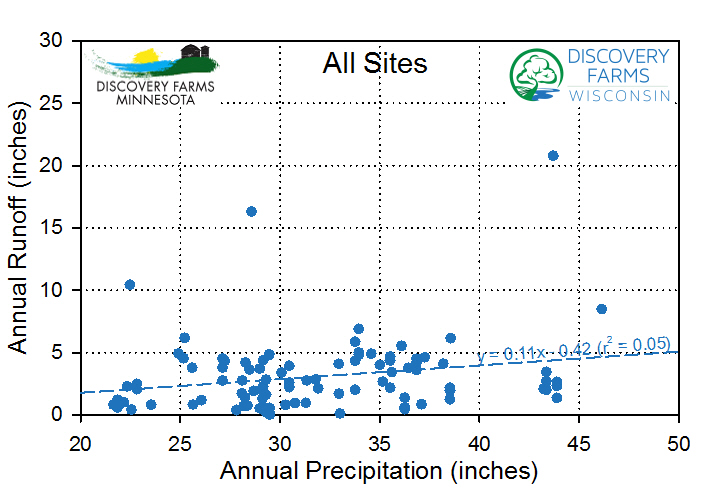
Please click here for part 1 of this blog which discusses annual precipitation and it’s relationship to surface runoff. Part 2 of this blog explores why annual precipitation is poor predictor of surface runoff from agricultural fields by examining the role of precipitation timing and intensity.
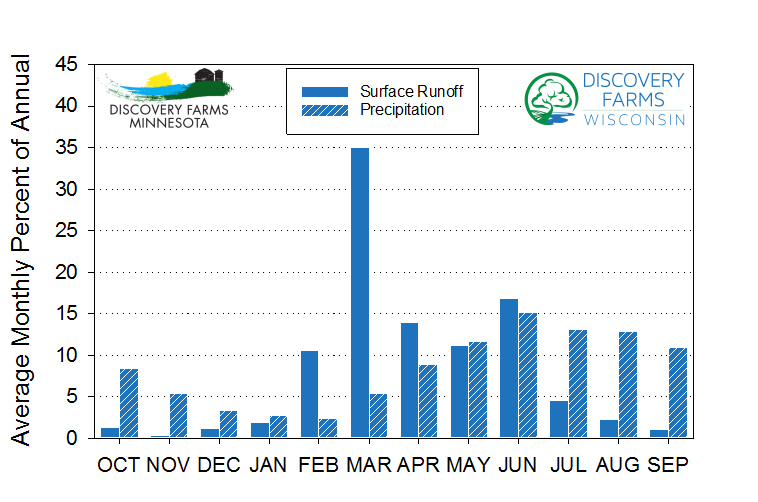
Precipitation timing and intensity can explain why the amount of annual precipitation is a poor predictor of surface runoff. Figure 2 displays the average monthly surface runoff and precipitation as a percentage of the annual total for edge-of-field monitoring sites in Wisconsin and Minnesota. There is a discrepancy between the time of most runoff and the time when most of the precipitation occurs. On average, February and March contribute 46% of the annual runoff and only 8% of the annual precipitation. The amount of precipitation has little effect on snowmelt, which is a major surface runoff factor, compared to other weather conditions such as frost depth and rate of melt. Also, about 2/3rds of the annual precipitation occurs from May through September, however, only about 1/3rd of the annual runoff occurs. During this time runoff is more limited because actively growing crops are using water and protecting the soil by providing a canopy.
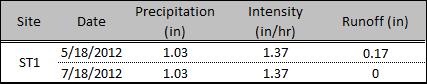
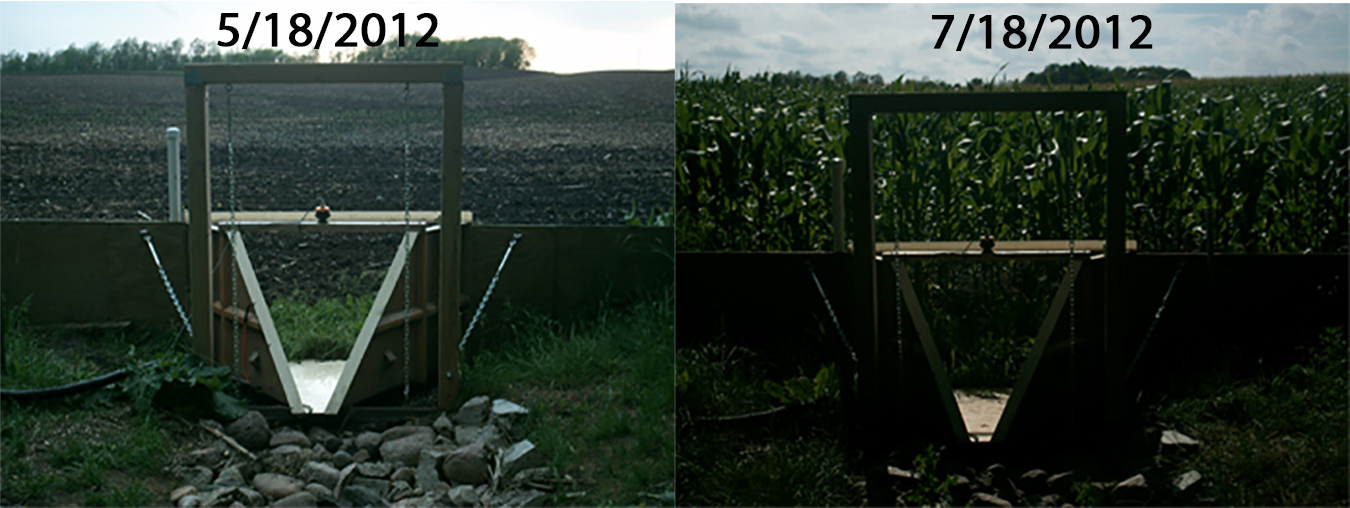
Timing of storm events during the growing season can also greatly impact the amount of surface runoff. Table 2 includes data from ST1. This site is located in Central Minnesota with poorly drained loam soils and a 4.1% average slope. In 2012, the field was planted to corn at the end of April. The table highlights two very similar rainfall events during 2012. Both events recorded 1.03 inches of rain in 45 minutes. However, the runoff response was much different due to the timing of the rainfall. The first event was in the middle of May before the corn crop developed a canopy and the second event was in the middle of July when the corn canopy was fully developed (Figure 3).
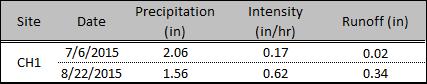
Precipitation intensity also impacts the amount of surface runoff. Table 3 includes data from CH1. This site is located in East-Central Minnesota with well drained loam soils and a 3.4% average slope. In 2015, the field was planted to corn at the beginning of May. The table highlights two storm events, July 6th and August 22nd, both when the field had a fully canopied corn crop. The July event had a higher amount of precipitation but a much lower intensity while the August event had a lower amount of precipitation with a higher intensity. The August event had a much higher runoff response because of the increased intensity.
When assessing surface runoff from agricultural fields, annual precipitation is a poor indicator for the amount of runoff. It is a poor indicator for surface runoff even for a fields with the same soil, slope, and crop type. The timing and intensity of precipitation are a much better indicatorsfor runoff potential for agricultural fields.
- Lessons Learned from Schafer Farms – Implementing Conservation in a Rolling Landscape - April 8, 2020
- What happened to spring? - July 15, 2019
- Tile flow and nutrient movement in Northwest Minnesota - September 13, 2018